The average daily rate fell to four cases per day in Burnaby. Four in five adults aged 50 or over in the city (80%) have received their first shot of the COVID-19 vaccine, along with more than three in four (76%) of those over the age of 18.
We have a special COVID-19 data map in which you can see detailed numbers by hovering over different parts of the city. Just click here to access it.
Burnaby continues to see improvements in its COVID-19 caseloads as B.C. continues to decline day-over-day.
According to the latest Geographic Distribution of COVID-19 by Local Health Area of Case Residence data for May 30 to June 5, 2021, Burnaby dropped to double digits for new infections with just 69.
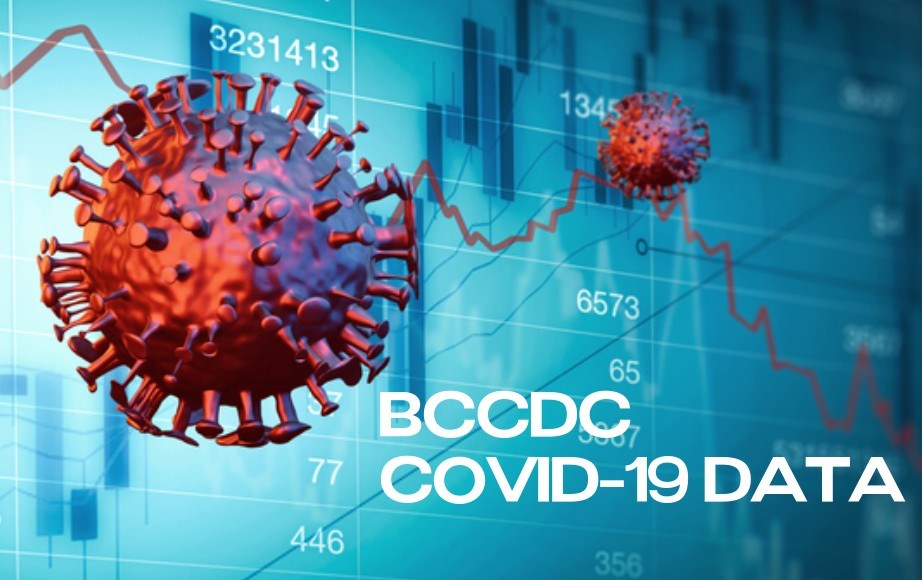
The data is released by the BC Centre for Disease Control.
From May 23 to 29, Burnaby recorded 123 cases. From May 16 to 22, there were 182 new infections discovered.


