The latest census data paints a picture of Burnaby including the wealthiest and poorest parts of town, according to a new city report.
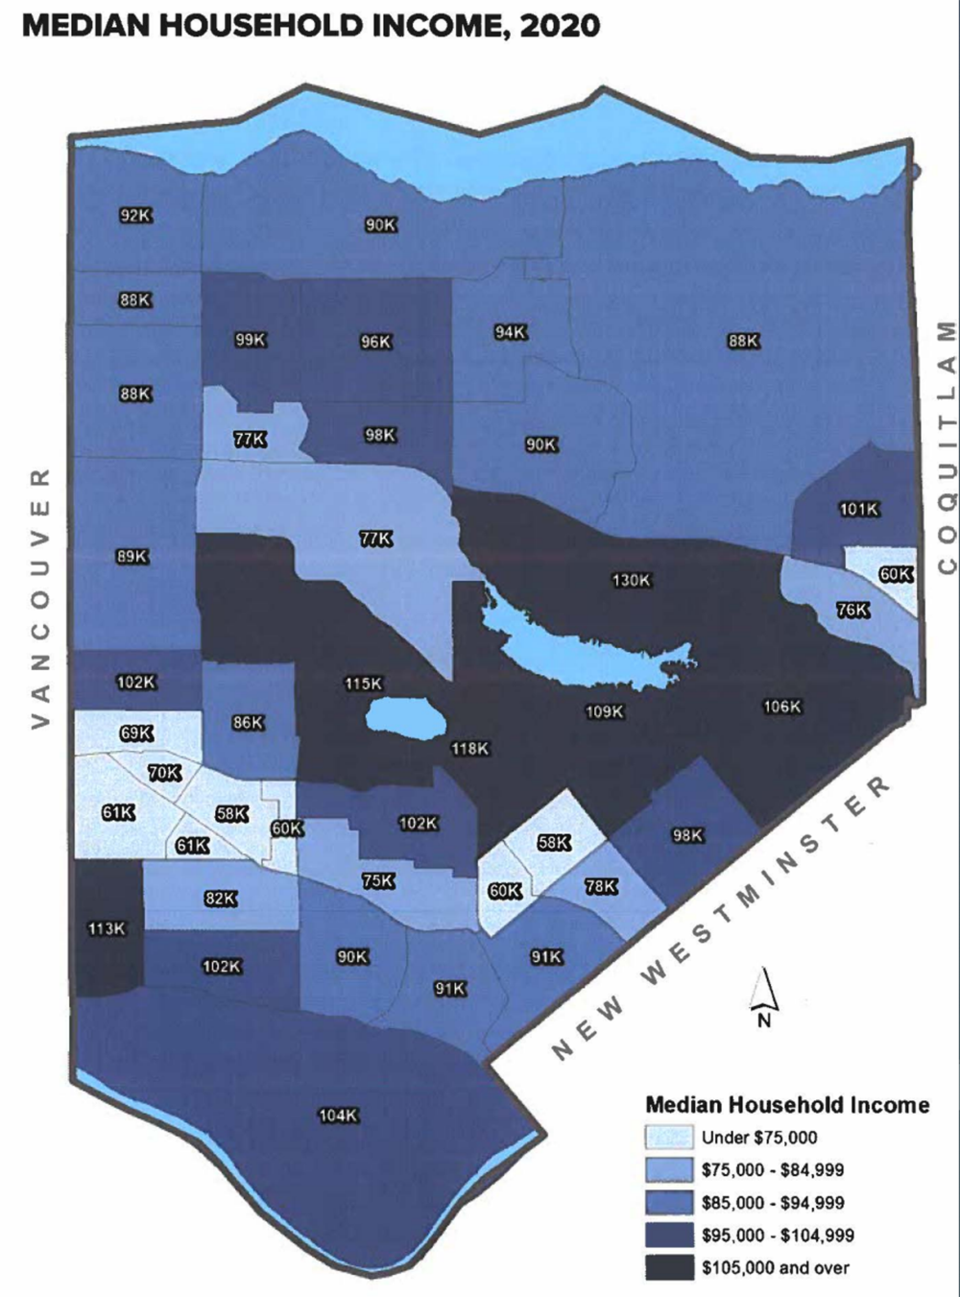
The lowest median incomes were in Metrotown, with the median in one area of the neighbourhood at $58,000, as well as parts of Edmonds with a median of $58,000 and of Lougheed with a median of $60,000.
Central Burnaby had the highest median incomes, around Government Road, Morley-Buckingham, Douglas-Gilpin and Oakalla, according to the report.
The highest median was just north of Burnaby Lake at $130,000.
The median before-tax household income in Burnaby overall was $83,000 in 2020, up from $64,737 in 2015.
About 29 per cent of households (28,865) earned less than $50,000 in 2020, while about 10 per cent of households (10,430) earned $200,000 or more.
Just over 30 per cent of households earned between $50,000 and $100,000.
Single people made the lowest median incomes, at $37,600 in 2020.
Almost 11,700 households in Burnaby had a total income of less than $25,000 in 2020.
Families and households in Burnaby
The census data also shows the number of private households growing from 92,200 in 2016 to 101,135 in 2021, an almost 10 per cent growth of 8,935 more households (a household is any group of people living in the same home).
The majority of households are singles living alone, at 29 per cent (29,575), then couples with children at 24 per cent (24,750). Couples without children make up 22 per cent of households, with 22,530.
The share in families living with others (including multigenerational families or unrelated people living together) has grown from 10 per cent in 2016 to 16 per cent in 2021, while the share of households of only one family is declining.
“In 2016, 62 per cent of all households were one-census-family households. By 2021, this share fell to 55 per cent,” states the report.
The report also includes data on languages spoken; more than 60 per cent of Burnaby residents know more than one language.
For more information on Burnaby’s demographics, see the staff report online.


