The Burnaby RCMP Crime Prevention Unit has issued its crime reduction bulletin for August and it highlights where crime is and isn’t hitting in the city.
The bulletin includes a series of maps that readers can see by scrolling through the images at the top of this page.
The maps cover auto thefts and break-and-enter crimes in different parts of the city.
Inserted below is a heat map that highlights the areas with the highest and lowest “density” of crime in Burnaby.
According to the heat map, the Metrotown area is marked in the darkest shade of red, meaning the highest density of crimes. This runs roughly from Patterson Avenue east to Gilley, and from Kingsway south to Imperial Street.
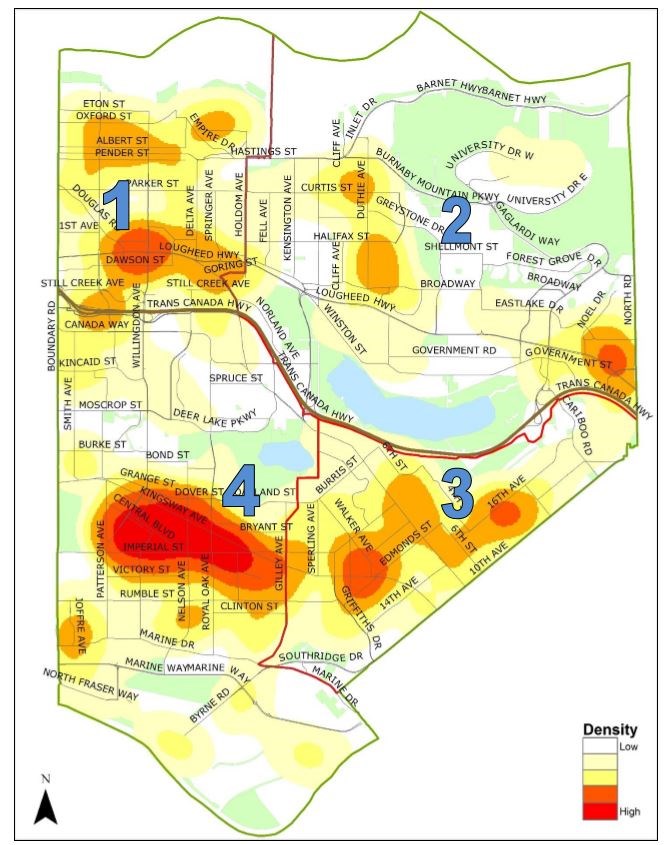
The neighbourhoods with the lowest density of crimes on the heat map are roughly Forest Grove and the southern part of UniverCity on Burnaby Mountain. There are other pockets of white on the map, including the eastern section of Deer Lake Parkway.
From the maps included above on this page, the predominant crime reported in Burnaby is thefts from autos, which are scattered all over the city. The areas called the Kingsway corridor and the Glenlyon Parkway industrial area in South Burnaby have been highlighted as theft from auto – catalytic converters. The next most predominant crimes are auto thefts.
As for break-and-enters, the map shows there are more businesses broken into than residences.
The introduction to the bulletin says “each crime type is compared to a three-year average.”

